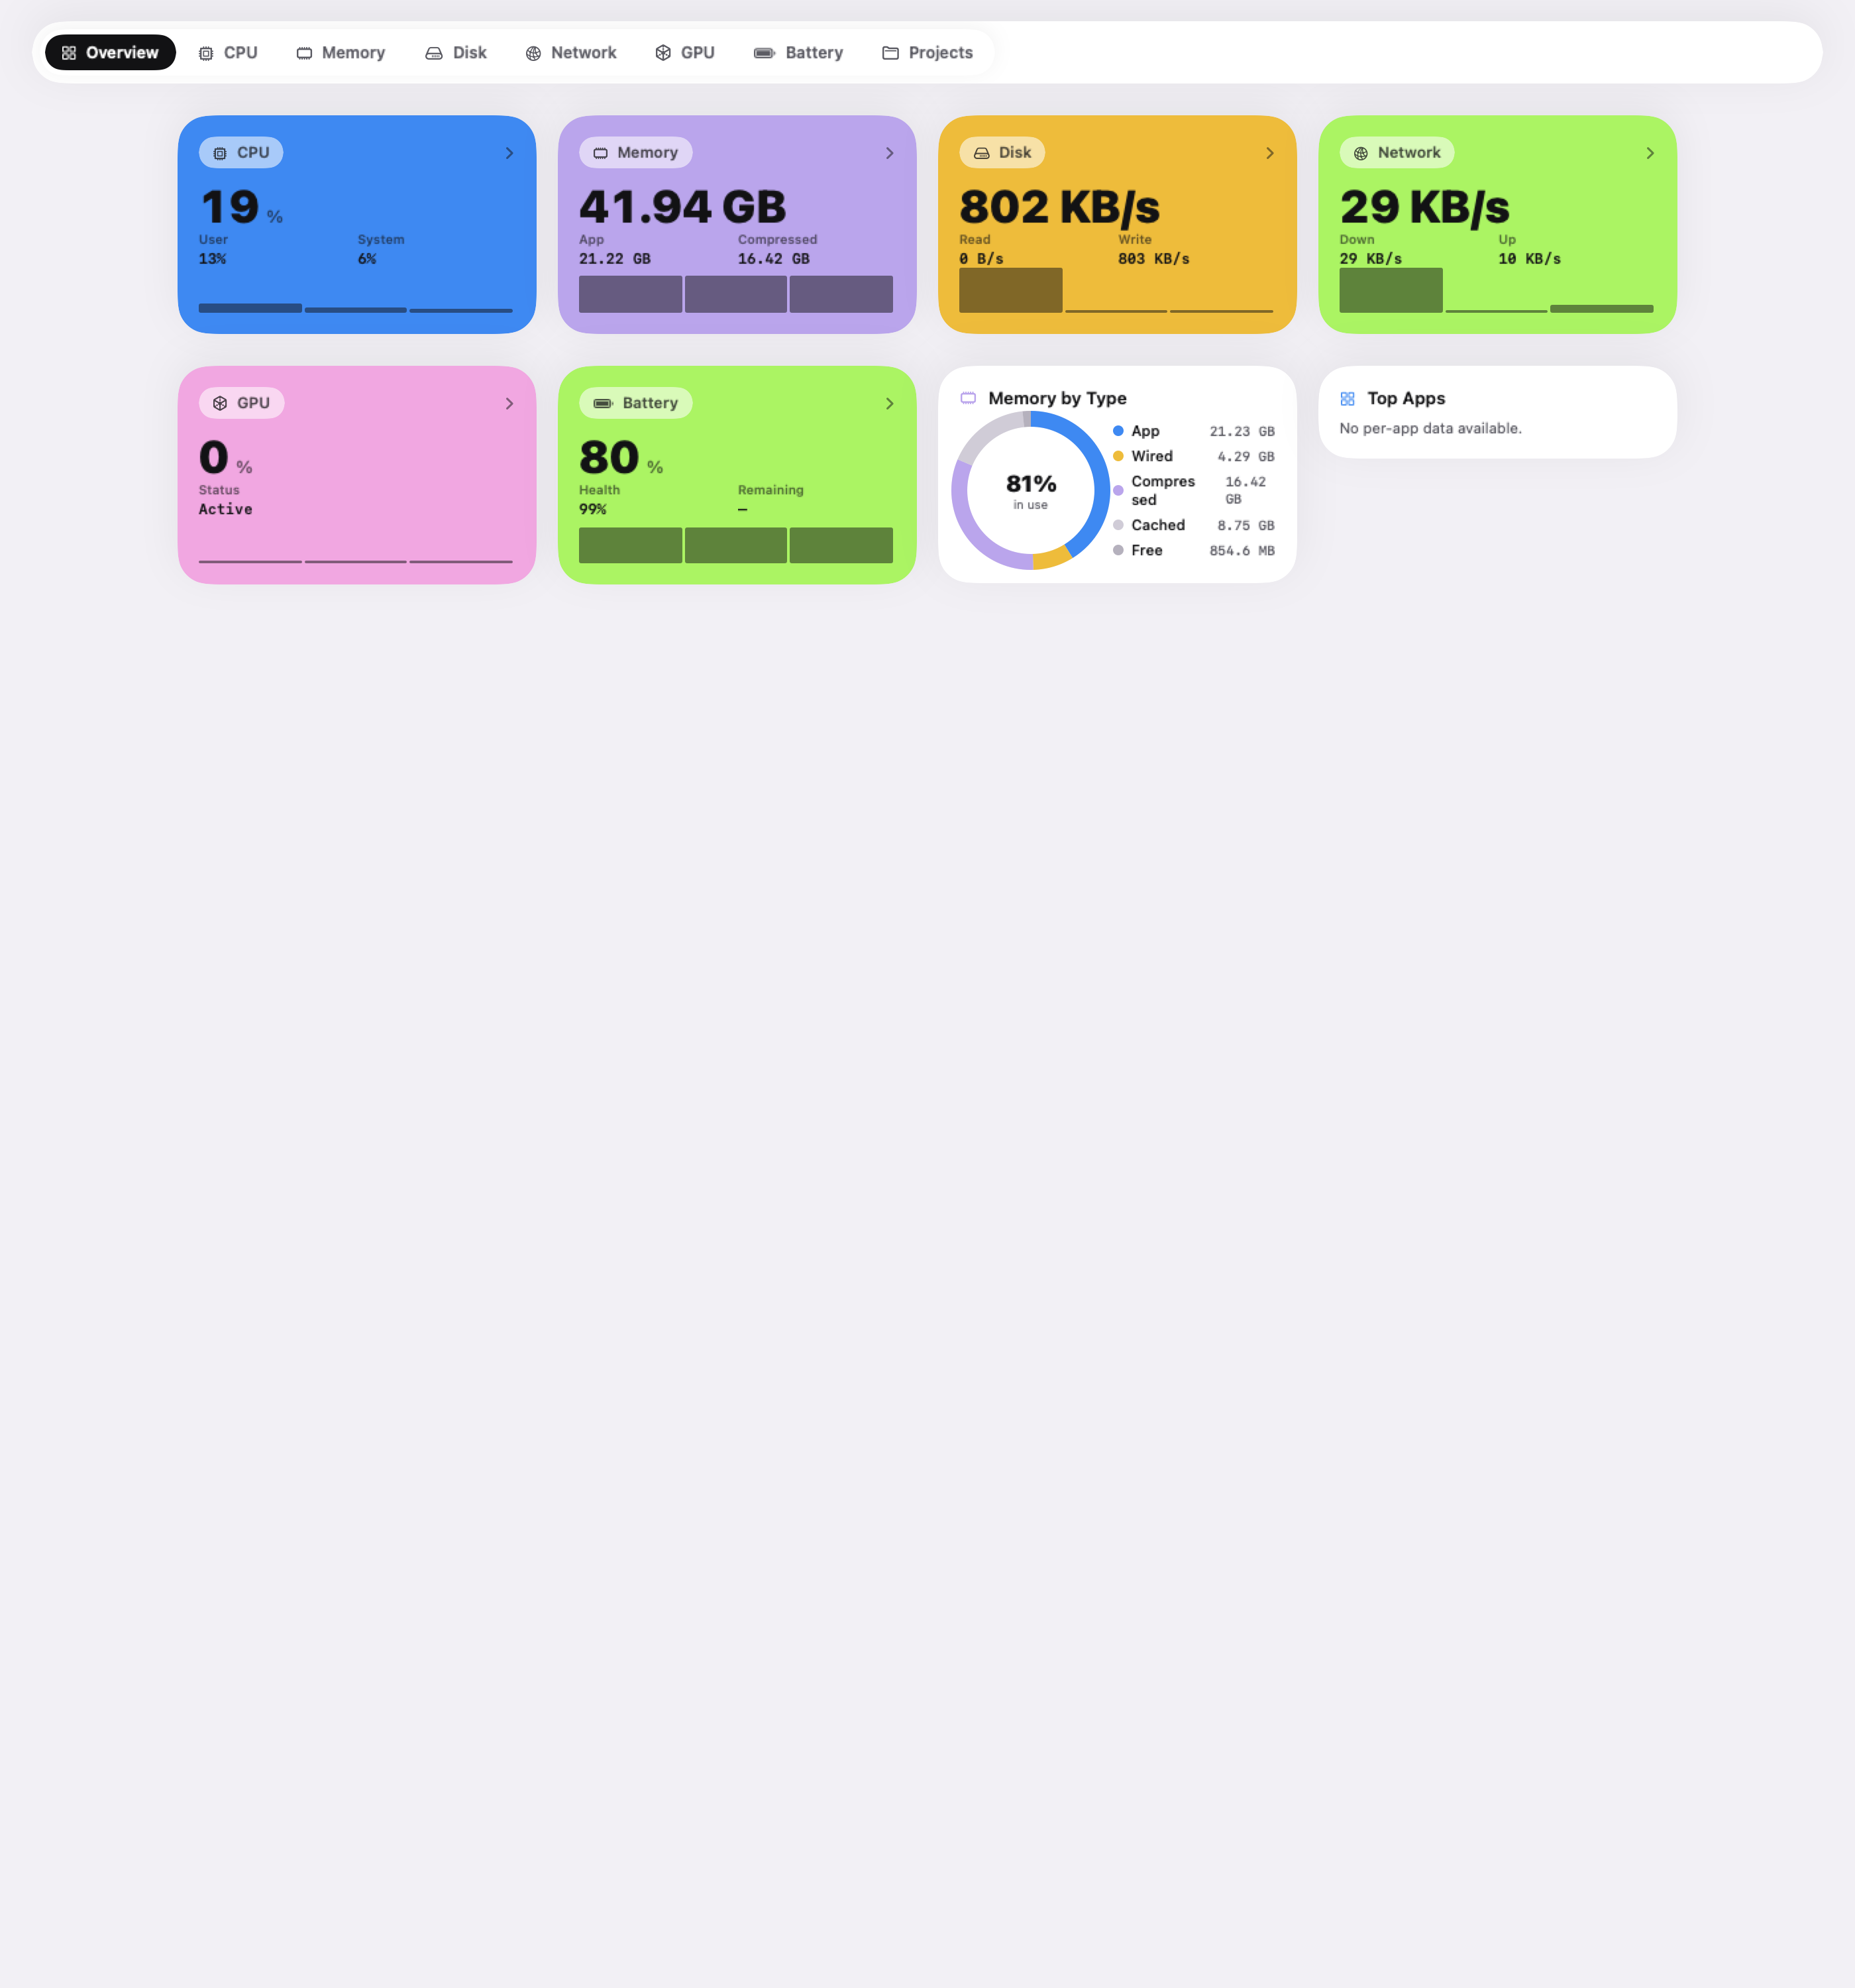
Short answer: MacMonitor is a native system monitor for Mac, sometimes called a performance or resource monitor, for macOS 14 or later. A menu bar panel has a page each for CPU, memory, disk, network, GPU, battery and storage, with live history and the busiest apps. A Health view keeps seven days of memory pressure, swap and thermal history, and optional alerts tell you when memory, disk space, CPU or heat need attention. It is part of the same one-time purchase as the cleaner and file organizer.
Total load with live history, the split between your apps and the system, and the apps using the most CPU
Memory
Memory pressure, used, wired, compressed and cached memory, and the apps using the most memory
Disk
Read and write throughput with history, plus free space
Network
Upload and download speed with history
GPU
GPU load with history where hardware and permissions provide it
Battery
Charge, health, cycle count, temperature and energy use by app on MacBooks
Health
Memory pressure, swap and thermal state, with seven days of history
Processes
Local servers listening on ports, and the project folder behind each one
Built for the menu bar
Click the MacMonitor icon in the menu bar for a page per metric. Apps are grouped, so a browser and all of its helper processes count as one app instead of twenty rows. When something needs attention, such as low disk space, high memory pressure, a runaway app or a low battery, the panel says so in one plain sentence with a button that takes you to the right page.
From the CPU and Memory lists you can ask an app to quit. MacMonitor confirms first, and the app can still offer to save your work.
Alerts, only if you want them
Alerts are off until you turn them on in Settings. MacMonitor can notify you when:
memory pressure stays critical for over a minute,
free disk space drops below 10 GB,
the CPU stays above 90% for five minutes,
macOS reports a Serious or Critical thermal state.
Each alert fires at most once an hour, and alerts run while MacMonitor is open. They use macOS notifications and send nothing anywhere.
MacMonitor and Apple's Activity Monitor
Activity Monitor comes with every Mac and is the right tool for deep, per-process detail: every process, energy impact, sampling a process, and inspecting open files. MacMonitor covers the everyday questions faster:
Activity Monitor
MacMonitor
Where it lives
A window you open
Menu bar panel and a full window
Apps with many helper processes
One row per process
Grouped into one app
Warnings in plain words
No
Yes, with a button to the right page
History
While the window is open
Live history, plus seven days of health history
Alerts
No
Optional, for memory, disk, CPU and heat
Local servers and ports
No
Yes, with the project behind each port
Disk cleanup and file organizing
No
Yes, in the same app
Price
Included with macOS
One-time purchase
Many people keep both: MacMonitor in the menu bar for a glance, and Activity Monitor when they need to dig into one process.
Light on your Mac
A monitor should not be the thing slowing your Mac down. MacMonitor uses one shared sampler for every view, slows its sampling when no window or panel is visible, and reads system counters rather than scanning files to measure activity.
Private by design
Activity data stays on your Mac. The app has no account and no analytics. See the privacy policy.
Use a monitor to answer a specific question
A Mac system monitor is most useful when a reading leads to a sensible next step. If an app is unresponsive, inspect the workload associated with it. If free storage is low, look for supported storage candidates. If memory pressure remains elevated during ordinary work, compare which applications need to run at the same time.
Do not use monitoring as a contest to keep every graph near zero. A processor, disk or network connection can be busy because it is doing work you requested. Read the units, time window and context before deciding that a high value means something is broken.
Compare a live reading with its history
A snapshot answers what was happening at one moment. A history helps show whether the event was brief, repeated or sustained. Those questions matter when you are deciding whether to wait for an export, investigate a recurring application problem, or change a workflow that repeatedly exceeds the machine’s available resources.
Keep the measurement definitions in mind. CPU load and CPU time differ; network throughput is not a speed test; disk throughput is not free capacity. Available GPU and battery measurements depend on the hardware and permissions. An unavailable measurement should not be interpreted as a zero workload.
Example: a busy build during a video call
Suppose a software build runs while you are on a video call. This fictional example can produce CPU activity, memory pressure and network traffic at the same time. The useful decision may be to postpone the build or reduce another nonessential task, not to stop random processes until the graphs look quieter.
Make one deliberate change through the application that owns the work, then compare the call’s responsiveness. If the issue repeats, record the workload and the change that helped. A monitor provides evidence for that decision; it does not establish a universal performance improvement for every Mac.
Choose alerts you can act on
An alert is useful when you understand what it means and what you intend to do. Before enabling one, consider whether you want to be notified during known heavy work. An optional sustained-load alert is different from a promise that a tool will automatically repair the underlying application.
MacMonitor’s alerts run while the app is open and use macOS notifications. Review their conditions in Settings and keep them aligned with your workflow. If an alert repeats, investigate the associated task and history instead of treating dismissal as a fix.
Know when to open Apple’s Activity Monitor
For a detailed process investigation, Apple’s built-in Activity Monitor remains an important tool. Use it when you need to inspect an individual process, compare its resource use, or follow Apple’s diagnostic instructions. A menu bar summary and a process-level investigation complement different stages of the same question.
The step-by-step CPU guide and memory-pressure guide explain those investigations without requiring a purchase. Choose an additional monitor if its presentation, grouped app view or history makes your regular decisions easier.
Check fit before purchasing a monitor
Verify the macOS requirement, the measurements your hardware can expose, and the distinction between the direct and App Store builds. If a particular sensor or detailed per-app reading is essential to you, confirm that capability for the intended build rather than inferring it from another machine’s screenshot.
The direct app’s license checks and user-initiated update request are documented in the privacy policy. The native app has no analytics, while website measurement is a separate consent-based choice. Those distinctions matter when comparing an offline monitoring workflow with a website or cloud service.
Common questions
Does MacMonitor replace Activity Monitor?
For daily checks, usually yes. For deep, per-process investigation, Activity Monitor is still useful, and the two work fine side by side.
Does it show which app is slowing my Mac?
Yes. The CPU and Memory pages list the busiest apps, grouped with their helper processes, and the panel calls out a runaway app in plain words.
Which Macs does it support?
Macs running macOS 14 or later. Battery details appear on MacBooks.
Is there more than monitoring?
Yes. The same app finds what is using disk space, cleans junk after you review it (Cleaner), and sorts messy folders with a preview of every move (Organizer). For the cleanup side, start with the guide to freeing up space.
Actual native development-build capture. Interface and readings reflect that capture, not a benchmark or a promise of reclaimed space. Current details are described in the text above.
Do it in one place
MacMonitor is a Mac cleaner, file organizer and activity monitor for macOS 14 or later. One-time purchase.